 Narrowsburg
Light Rain Fog/Mist, 43°
Wind: 8.1 mph
 Narrowsburg
REGION — If the answers were easy, the county’s health ranking would be raised.
To figure out why Sullivan County is 61 out of 62 counties in low health outcomes, we looked at a buffet …
Stay informed about your community and support local independent journalism.
Subscribe to The River Reporter today. click here
This item is available in full to subscribers.
Please log in to continue |


REGION — If the answers were easy, the county’s health ranking would be raised.
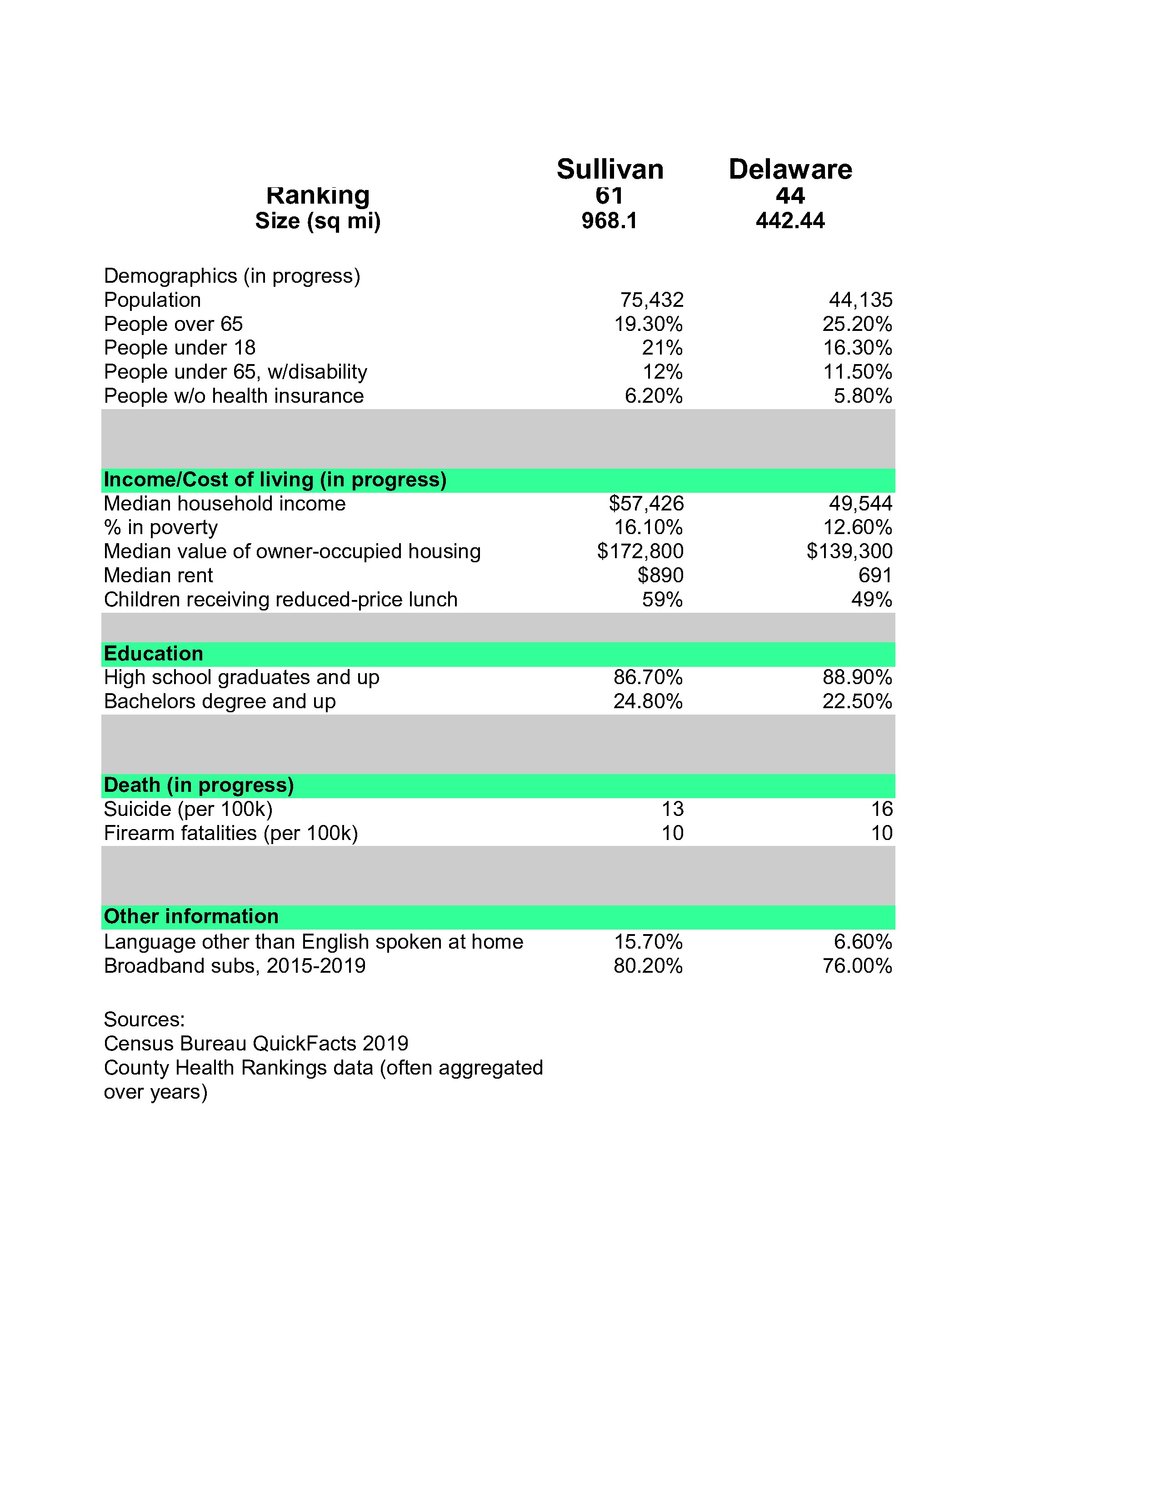
To figure out why Sullivan County is 61 out of 62 counties in low health outcomes, we looked at a buffet of counties and their rankings in outcomes: Sullivan (#61), Delaware (#44), Ulster (#24), Montgomery (#56), Orleans (#60), the Bronx (#62), Rockland (#1) and Wayne, PA (26 out of 67) because it’s right next door.
The counties chosen were almost all rural. While Ulster isn’t completely rural, parts are, which caused us to wonder if counties could have health outcome differences within themselves.
Some data stood out. None of it will be a surprise to county leaders who have been working on the problem for a decade.
The ranking is based on a spectrum of data.
Premature death: A County Health Rankings measure, premature death means death before the age of 75, per 100,000, and factors in “years of life lost.” Sullivan scored 8,000; Orleans County was at 7,800. The Bronx was 6,700. Rockland was 4,400.
Geography: The New York State Health Foundation (NYSHF) compares counties over time. Between 2010 and 2019, the 12 counties that declined in health outcomes “were clustered in Western New York, Central New York and the Southern Tier.” Few counties in New York State showed large improvements in overall health outcomes between 2010 and 2019, said the NYSHF. “More counties demonstrated a large decline.”
The New York counties that consistently ranked in the top 20 percent “tended to cluster in the Long Island and Hudson Valley regions, as well as in the Genesee Valley, Central New York and the Capital District.”
Although Sullivan is technically part of the Hudson Valley, it, and the Bronx, were consistently ranked at the bottom.
It is also not consistent that rural counties have worse outcomes, as several of the most rural counties in our sample (Delaware, Montgomery and Wayne County, PA) did better ranking-wise. It is significant to note that county health rankings are full of cautions about comparing across state lines.
Even then, population size is not a significant factor. Putnam County, with just under 100,000 people, is one of the healthiest counties. It’s also one of the wealthiest, with a median household income of $104,500 and a five-percent poverty rate. Sullivan’s median income is $57,426, and it was not the lowest among counties chosen. That was Montgomery, at $49,462. The medium income in The Bronx is $40,088.
Poverty. According to census data, 16 percent of Sullivan’s population is poor (per census poverty thresholds). Montgomery is similar (15.9 percent). But Delaware and Orleans had a lower poverty rate (12.6 and 13.2 percent, respectively) and far fewer people than Sullivan. Rockland had a 12.5 percent poverty rate.
When it comes to children in poverty, Sullivan reports that 59 percent of its kids receive reduced-price lunches. Montgomery was next at 56 percent. Wayne County, PA and Orleans came in at 50 percent. The Bronx was on top at 86 percent.
Suicides and firearm fatalities: Generally, rural counties had double-digit suicide and firearm fatality rates per 100,000 people. Wayne County, PA was the highest in our sample at 27 suicides and 23 firearm fatalities per 100,000. Sullivan had 13 and 10; Delaware had 16 and 10; Montgomery 12 and eight. The Bronx had five and four per 100,000, and Rockland had seven and three.
Uninsured: Sullivan’s uninsured rate was 6.2 percent. Delaware was 5.8 percent. Orleans, Montgomery and Rockland were 5.3 percent. Wayne, PA was 7.5 percent. The Bronx was 8.7 percent.
Note that both states have expanded Medicaid.
So, what does this tell us?
First, that jobs (or lack thereof), food insecurity, sexually transmitted diseases, demographics, or other topics that might matter are not considered.
And second, because the ranking is dependent on layers of factors that lead to a low health outcome, systemic change is necessary and that’s extremely had to achieve. To access a spreadsheet that tracks these identifiers, check out the attached spreadsheet or pdf file at the top of this story or click here.
What are the County Health Rankings?
The Robert Wood Johnson Foundation/University of Wisconsin Population Health Institute annual county health rankings pushes counties to examine what’s controllable, suggests effective policies and offers actions for communities and lawmakers to take.
Their model looks at health outcomes, based on length of life and quality of life (some of that data is self-reported), and at health factors, like access to medical care, health behaviors, socio-economic data and effect of the environment.
It goes through 2019 and so does not include the effects of COVID-19.


Comments
No comments on this item Please log in to comment by clicking here